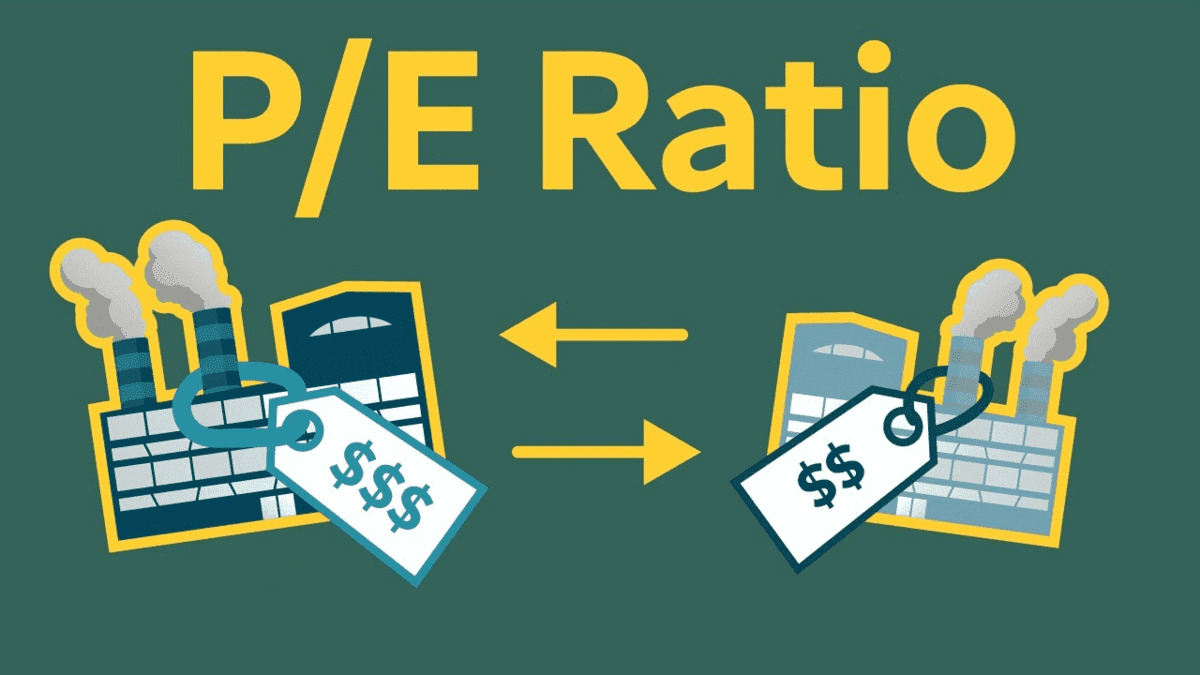
The Price-to-Earnings (P/E) ratio stands as one of the most fundamental and widely-used metrics in stock valuation, serving as a crucial compass for investors the complex world of financial markets. This powerful tool compares a company’s current stock price to its earnings per share, essentially revealing how much investors are willing to pay for each dollar of the company’s profits. Whether you’re a seasoned investor or just beginning your investment journey, understanding the P/E ratio can significantly enhance your ability to identify potentially undervalued or overvalued stocks. The ratio acts as a financial shorthand that helps determine whether a stock’s current market price represents good value relative to the company’s earning power. By mastering this essential metric, investors can make more informed decisions about when to buy, hold, or sell stocks, ultimately improving their investment outcomes and building a more robust portfolio strategy.
Understanding the P/E Ratio Formula
The P/E ratio calculation is refreshingly straightforward, making it accessible to investors at all experience levels. The formula divides the current market price per share by the company’s earnings per share (EPS):
P/E Ratio = Stock Price ÷ Earnings per Share (EPS)

For example, if a company’s stock trades at $75 and its EPS is $3, the P/E ratio would be 25, meaning investors are paying $25 for every $1 of earnings. This calculation provides immediate insight into how the market values the company’s profitability relative to its current stock price.
Types of P/E Ratios
Trailing P/E Ratio
The trailing P/E ratio uses actual earnings from the past 12 months, providing a reliable metric based on historical performance. This backward-looking approach offers concrete data but may not reflect future potential or recent changes in company performance.
Forward P/E Ratio
Forward P/E ratios utilize analysts’ earnings forecasts for the coming year, offering insights into future stock value potential. While more speculative, forward P/E ratios can be particularly valuable when analysts expect significant earnings growth, potentially showing a lower ratio despite current high valuations.
Cyclically Adjusted P/E (CAPE) Ratio
The CAPE ratio takes a longer-term view, using average earnings over 10 years adjusted for inflation. This approach smooths out earnings fluctuations and is particularly useful for evaluating market performance and identifying long-term trends.
Interpreting P/E Ratios

High P/E Ratios
A high P/E ratio typically indicates that investors have strong expectations for future growth and are willing to pay a premium for the stock. However, it can also signal that a stock is overvalued and may face price corrections if the company fails to meet growth expectations.
Low P/E Ratios
Low P/E ratios may suggest that a stock is undervalued and represents a potential bargain. Alternatively, it could indicate that investors are skeptical about the company’s future prospects or that systematic risks are affecting the stock’s valuation.
Strategic Applications of P/E Ratios
Industry Comparisons
P/E ratios are most valuable when comparing companies within the same industry, as different sectors naturally trade at different valuation ranges. Technology companies, for instance, typically command higher P/E ratios than utility companies due to their growth potential.
Historical Analysis
Comparing a company’s current P/E ratio to its historical range provides valuable context for investment decisions. If a stock is trading near the lower end of its historical P/E range, it may present an attractive investment opportunity.
Market Timing
For broader market analysis, indices like the Nifty have historically traded in P/E ranges of 10 to 30, with an average around 20. P/E ratios below 20 may indicate favorable market entry points for long-term investors.
Limitations and Considerations
While P/E ratios are invaluable tools, they shouldn’t be used in isolation. Companies with negative earnings have undefined P/E ratios, and the metric doesn’t account for debt levels, growth rates, or industry-specific factors. Successful investors combine P/E analysis with other fundamental metrics such as earnings growth, revenue trends, and balance sheet strength to make comprehensive investment decisions.
The P/E ratio remains an essential starting point for stock valuation, offering quick insights into market sentiment and relative value. When used thoughtfully alongside other analytical tools, it can significantly enhance investment decision-making and help identify compelling opportunities in the ever-evolving stock market landscape.
