
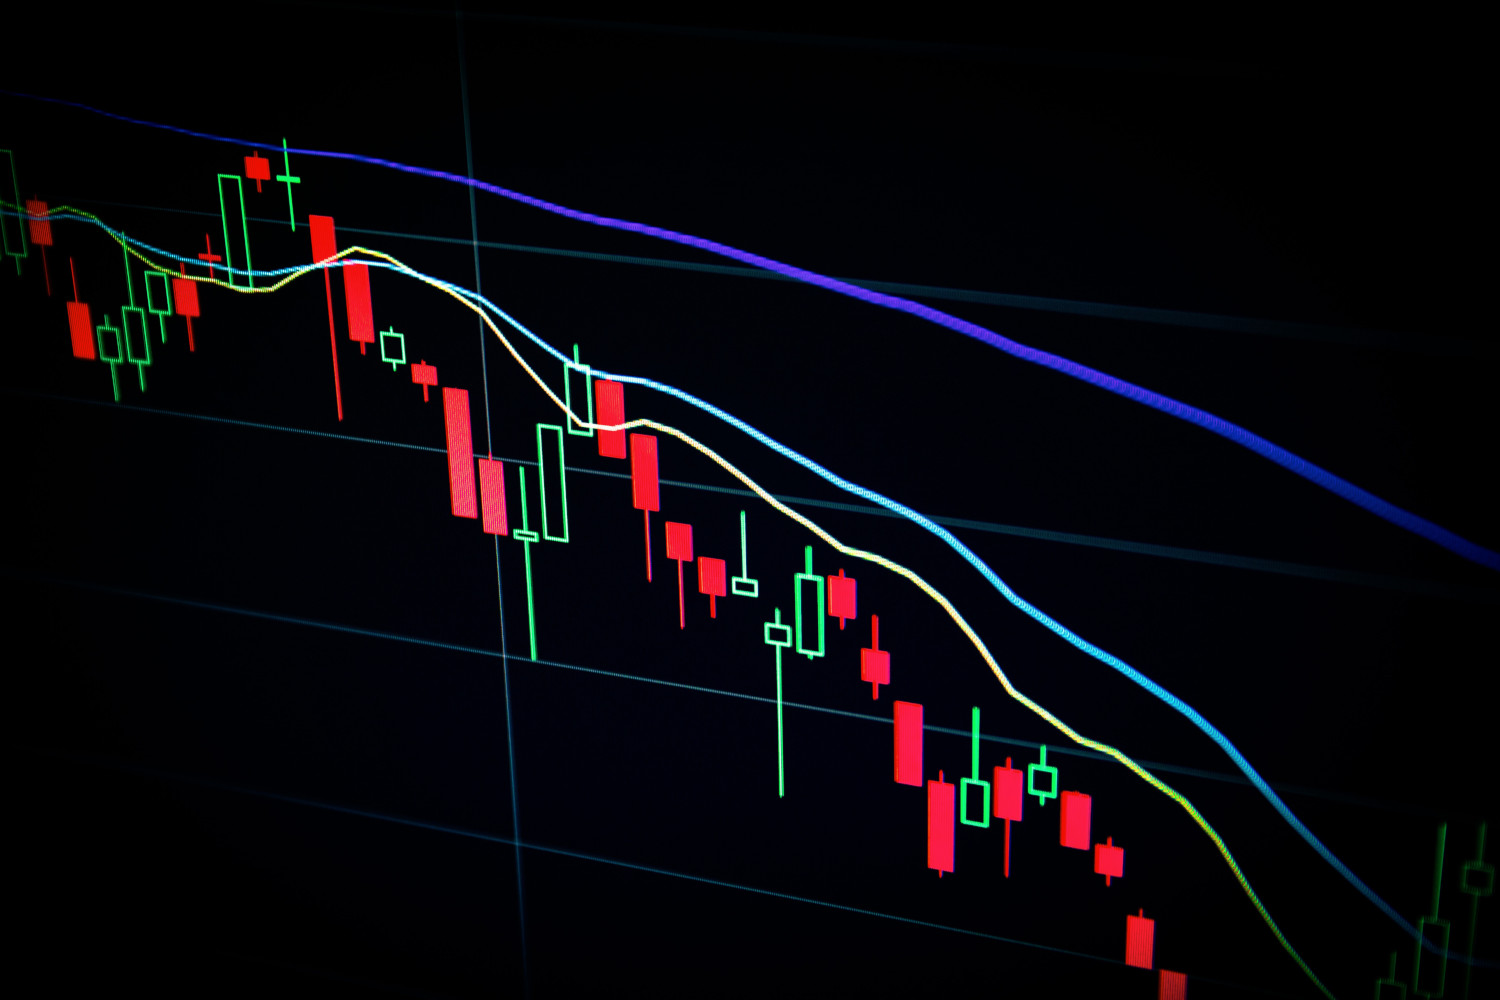
The stock market requires more than intuition—it demands a solid understanding of technical indicators that help predict price movements and identify trading opportunities. These mathematical tools, derived from historical price and volume data, serve as the foundation for informed investment decisions. Whether you’re a beginner trader or an experienced investor, mastering these indicators can significantly improve your market performance and risk management strategies.
Technical indicators fall into several categories: momentum oscillators that measure price speed, trend indicators that identify market direction, volume indicators that confirm price movements, and volatility measures that assess market uncertainty. Each indicator offers unique insights into market behavior, and when used together, they create a comprehensive analytical framework. The key to successful trading lies not just in understanding individual indicators but in combining them strategically to confirm signals and reduce false positives.
As we advance through 2025, these ten essential indicators remain the cornerstone of technical analysis, helping traders navigate increasingly complex market conditions with greater confidence and precision.
Momentum Indicators
Moving Average Convergence Divergence (MACD)
The MACD stands as one of the most versatile and powerful indicators in technical analysis. This momentum indicator tracks the relationship between two moving averages of a security’s price, consisting of the MACD line, signal line, and histogram. When the MACD line crosses above the signal line, it generates a buy signal, while crossing below indicates a potential sell opportunity. The MACD excels at identifying trend changes and momentum shifts, making it invaluable for both trend-following and reversal strategies.
Relative Strength Index (RSI)
The RSI measures the speed and magnitude of price changes on a scale from 0 to 100. This momentum oscillator helps traders identify overbought conditions (above 70) and oversold conditions (below 30). However, experienced traders often wait for the RSI to move beyond these thresholds and then return before taking action, reducing the risk of premature entries. The RSI also reveals divergences between price and momentum, often signaling potential trend reversals before they occur in the actual price.
Stochastic Oscillator
This momentum indicator compares a security’s closing price to its price range over a specific period. The stochastic oscillator moves between 0 and 100, with readings above 80 suggesting overbought conditions and below 20 indicating oversold levels. It uses two lines that, when they intersect, may signal potential trend reversals, making it particularly useful for identifying entry and exit points in range-bound markets.
Trend Indicators
Moving Averages (MA and EMA)
Moving averages smooth out price fluctuations to reveal the underlying trend direction. Simple Moving Averages (SMA) provide equal weight to all data points, while Exponential Moving Averages (EMA) give greater emphasis to recent prices, making them more responsive to new information. Traders often use crossovers between short-term and long-term moving averages as buy and sell signals.
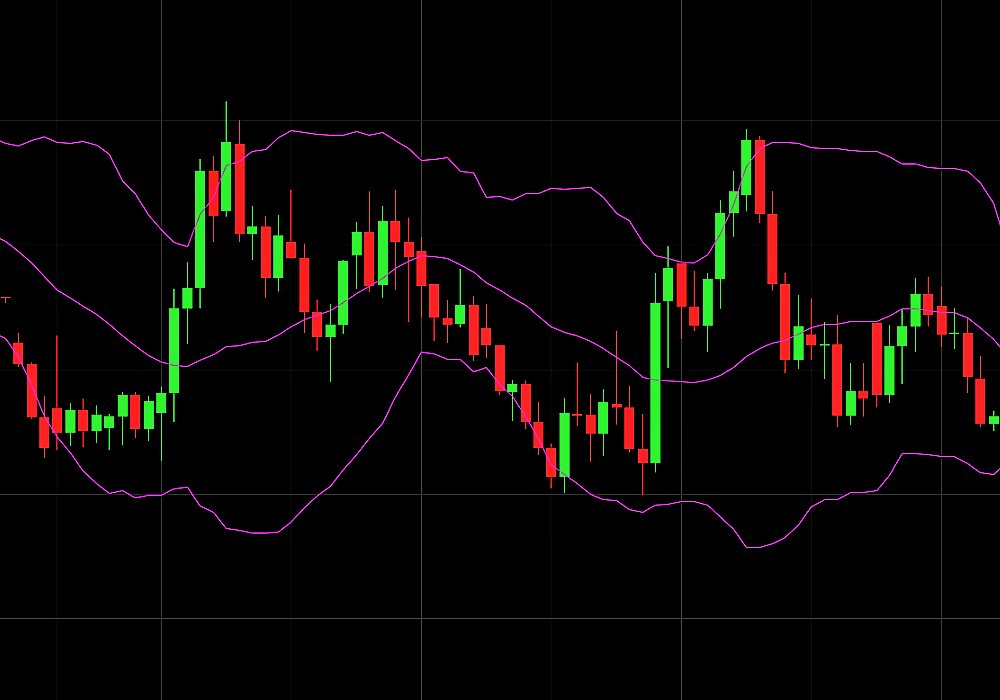
Bollinger Bands
These volatility indicators consist of a moving average with two standard deviation bands above and below it. Bollinger Bands expand during periods of high volatility and contract during low volatility phases. When prices consistently touch the upper band, the asset may be overbought; when they touch the lower band, it may be oversold. The bands also help identify potential breakout opportunities when they narrow significantly.
Average Directional Index (ADX)
The ADX measures trend strength regardless of direction, helping traders determine whether a market is trending or ranging. Values above 25 typically indicate a strong trend, while readings below 20 suggest a weak or non-trending market. This indicator proves invaluable for deciding whether to use trend-following or range-trading strategies.
Volume and Support Indicators
On-Balance Volume (OBV)
OBV combines price and volume data to measure buying and selling pressure. When volume increases on up days and decreases on down days, OBV rises, indicating accumulation. Conversely, when volume is higher on down days, OBV falls, suggesting distribution. This indicator often leads price movements, providing early signals of potential trend changes.
Fibonacci Retracement
This tool identifies potential support and resistance levels based on the mathematical relationships found in the Fibonacci sequence. Traders use these levels to pinpoint entry points during pullbacks in trending markets and to set profit targets. The most commonly watched retracement levels are 38.2%, 50%, and 61.8%.
Ichimoku Cloud
This comprehensive indicator provides information about support and resistance levels, trend direction, and momentum in a single chart. The “cloud” formed by two lines helps identify the trend, while the other components provide specific entry and exit signals. Its ability to forecast future support and resistance levels makes it particularly valuable for longer-term analysis.
Parabolic SAR
The Parabolic Stop and Reverse indicator appears as dots above or below price bars, indicating trend direction and potential reversal points. When dots appear below the price, it suggests an uptrend; when above, it indicates a downtrend. This indicator excels at providing trailing stop-loss levels and identifying when trends may be losing momentum.